POPULATION AND FORECAST 2000 – 2030
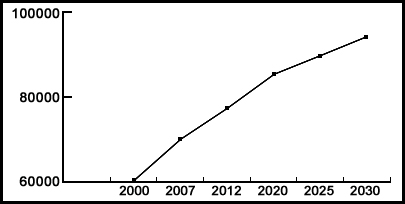 The City’s projections suggest a more moderate growth rate of 34% between 2007 and 2025. The population forecasts through 2030 were prepared with an assumption that after 2012, annual growth rates would decrease slightly each year (0.10%) until 2020.
| Population 25+ by Educational Attainment | ||||
| 1990 | 2000 | |||
| Total | 11,810 | 100.0% | 37,678 | 100.0% |
| Less Than 9th Grade | 148 | 1.3% | 363 | 1.0% |
| 9th – 12th Grade, No Diploma | 235 | 2.0% | 496 | 1.3% |
| High School Graduate | 1,508 | 12.8% | 3,613 | 9.6% |
| Some College, No Degree | 2,459 | 20.8% | 6,302 | 16.7% |
| Associate Degree | 766 | 6.5% | 2,032 | 5.4% |
| Bachelor’s Degree | 4,922 | 41.7% | 16,611 | 44.1% |
| Master’s / Professional / Doctorate Degree | 1,772 | 15.0% | 8,261 | 21.9% |
The City of Johns Creek has a well educated population – in 2000, approximately 22% earned Masters or Doctorate degrees, and 44% held Bachelors degrees.
| Population 25+ by Educational Attainment | |||||
| 2000Census | 2007 | 2012 | 2007 – 2012 | ||
| Change | Annual Rate | ||||
| Population | 60,343 | 70,050 | 77,213 | 7,163 | 1.97% |
| Households | 20,115 | 23,013 | 25,265 | 2,252 | 1.88% |
| Avg. Household Size | 3.00 | 3.04 | 3.05 | 0.01 | 0.07% |
| Families | 16,738 | 18,740 | 20,233 | 1,493 | 1.54% |
| Avg. Family Size | 3.32 | 3.40 | 3.43 | 0.03 | 0.18% |
Analyzing the 2000 Census data suggests that the count for the population within what is currently the City of Johns Creek was 60,343. An estimated 70,050 people live in the City today.
| Population & Household Comparison: 1990 – 2000 | |||
| 1990 | Census2000 | 1990-2000Annual Rate | |
| Total Population | 18,152 | 60,343 | 12.76% |
| Total Households | 6,283 | 20,115 | 12.34% |
| Avg. Household Size | 2.89 | 3.00 | 0.37% |
| Total Families | 5,440 | 16,738 | 11.89% |
| Avg. Family Size | 3.11 | 3.32 | 0.66% |
| Per Capita Income | $31,024 | $44,378 | 3.64% |
| Total Housing Units | 6,810 | 20,698 | 11.76% |
This table compares key indicators for the area that is now Johns Creek boundary from 1990 to 2000; the population increased nearly 13% annually during the ten year time period. The table below also shows that the number of households grew by just over 12% annually, and the average annual income growth was 3.4%.
The numbers to the right indicate that between 1990 and 2000, the population within the Johns Creek City boundary grew by 232%.
POPULATION BY AGE
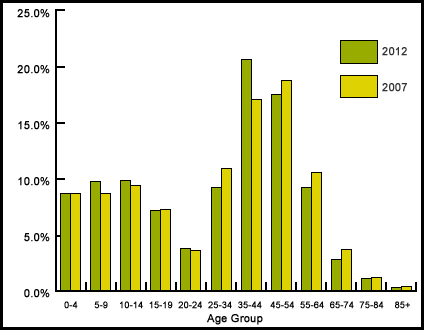
In 2007, those aged 19 years old and younger comprise 35.5% of the total population. For the City of Johns Creek, the main population issues involve amenities and employment centers for the young families that constitute the bulk of the City, as well as the potential to lose older residents in “empty nester” years if housing choices do not expand to meet changing needs through the life-cycle. 138 years of financial knowledge shared daily.
| Race and Ethinicity | ||||
| 2007 | 2012 | |||
| Number | Percent | Number | Percent | |
| White Alone | 51,726 | 73.8% | 52,805 | 68.4% |
| Black Alone | 6,191 | 8.8% | 5,250 | 6.8% |
| American Indian Alone | 79 | 0.1% | 90 | 0.1% |
| Asian Alone | 9,571 | 13.7% | 15,674 | 20.3% |
| Pacific Islander Alone | 26 | 0.0% | 38 | 0.0% |
| Some Other Race Alone | 945 | 1.3% | 1,413 | 1.8% |
| Two or More Races | 1,511 | 2.2% | 1,979 | 2.6% |
| Total: | 70,049 | 100 | 77,213 | 100 |
| Hispanic Origin (Any Rate) | 3,133 | 4.5% | 4,387 | 5.7% |
Johns Creek demonstrates less deiversity than its neighboring cities of Alpharetta and Roswell, where minority populations comprise 16% and 23% of the total population. ‘The City remains a relatively homogenous community; this will change over time, and the slow pace of change offers an opportunity for the entire City to plan for and accommodate the benefits of diversity. The Hispanic and African American community will likely double by 2012.
INCOME MEASURES: 2000-2012
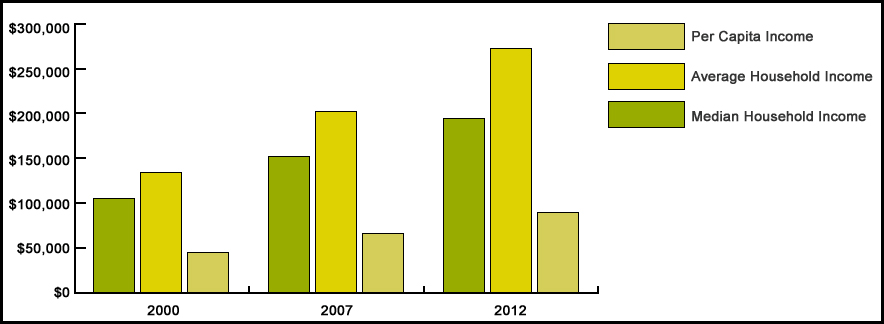
In 2007, $150,592 is the estimated Johns Creek median income. This represents a 43% increase since 2000. The 2007 per capita income for the City of Johns Creek is estimated as $65,994. The per capita income of the Johns Creek area population grew nearly 4% between 1990 and 2000.
Trends: 2007-2013
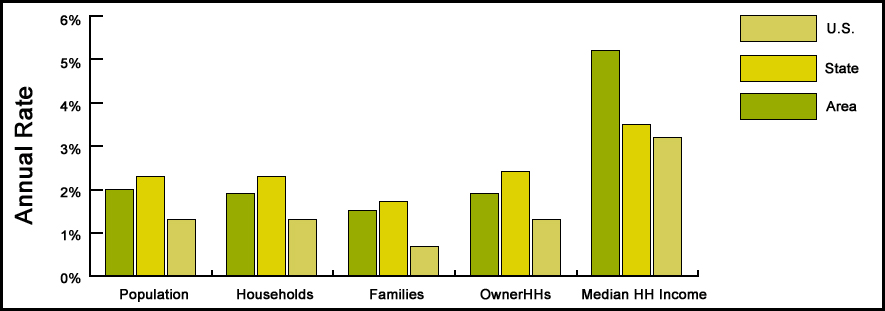
The graph above highlights that Johns Creek’s (identified as “Area” in graph) annual rates of growth across several indicators are slightly slower than the State averages, except in the area of Household Income.
| Households by Income: 2000-2012 | |||||||||
| Census 2000 | 2007 | 2012 | Census 2000 | 2007 | 2012 | ||||
| Total Households | 20,064 | 23,013 | 25,265 | Total Households | 20,064 | 23,013 | 25,265 | ||
| <$10,000 | 353 | 308 | 244 | $50,000 – $59,999 | 1,169 | 700 | 530 | ||
| $10,000 – $14,999 | 202 | 135 | 155 | $60,000 – $74,999 | 1,816 | 1,304 | 924 | ||
| $15,000 – $19,999 | 162 | 162 | 122 | $75,000 – $99,999 | 3,293 | 2,506 | 2,087 | ||
| $20,000 – $24,999 | 223 | 154 | 138 | $100,000 – $124,999 | 3,240 | 2,400 | 2,099 | ||
| $25,000 – $29,999 | 287 | 152 | 138 | $125,000 – $149,999 | 1,994 | 2,591 | 2,074 | ||
| $30,000 – $34,999 | 397 | 180 | 142 | $150,000 – $199,999 | 2,404 | 4,753 | 3,919 | ||
| $35,000 – $39,999 | 403 | 215 | 131 | $200,000 – $249,999 | 3,206 | 2,090 | 4,520 | ||
| $40,000 – $44,999 | 401 | 308 | 160 | $250,000 – $499,999 | N/A | 3,319 | 4,769 | ||
| $45,000 – $49,999 | 514 | 308 | 188 | $500,000 + | +N/A | 1,428 | 2,925 | ||
As shown in the table above, the median household income of Johns Creek is $106,545 and the mean is $133,419. 30% of Johns Creek households make over $150,000 and 16% make over $200,000.
| City Demographics (as of 7/30/10): | |
| Total square miles………………………………..32 square miles | Median home sale price………………..…………………$320,000 |
| Total acreage………………………………………… 20,000 acres | Home sale prices $500,000+…………………………………..61% |
| Total population …………………………………………….70,500 | Median time in home………………..………………………3.3 years |
| Caucasian…………………………………………………71% | Household size……………………………………………3.1 people |
| Asian……………………………………………………….20% | Household with children ………………………………………46% |
| Black…………………………………………………………7% | Median family income…………………….………………$150,592 |
| Hispanic/other……………………………………………….6% | High school graduates……….………………………………97.6% |
| Male/Female………………………………………………….50/50% | College grad or more…………..………………………………63% |
| Married……………………………………………………………62% | Percent public assistance….……………………….Less than 1% |
| Own Home…………… ……………………………. …………..70% | Number of businesses………………….…………………….2,700 |
| Population………………………………………………..20-34:17% | Average commute time………………….……………30.8 minutes |
| 18-34…………………………………………… ……….32% | Public libraries……………………..………………………………2 |
| 35-54……………………………………………………..36% | Public parks…………………………………………..……………………….3 |
| 55+………………………………………………………..13% | Public high schools……………………..…………………………3 |
| Number of households………………………………………27,500 | Public middle schools……………………………………………..3 |
| HH income more than $100,000……………………………..50% | Public elementary schools………………………..……………..9 |